The 2026 Water Rate Increase Wave: What Commercial Properties Should Do Now
Cities across the U.S. are raising or changing water, sewer, drought, and stormwater costs in 2026. This national analysis explains what the pattern means for commercial properties.
Key Takeaway
The 2026 water-rate story is national. San Diego raised water 14.7% and wastewater 6%; Columbus raised water 18% and sewer 8%; Denver and Aspen added drought pressure; Tacoma, Goodyear, Toledo, and Cincinnati show meter-size, sewer, stormwater, and tier complexity; and several cities adopted or proposed multi-year schedules. Commercial properties should treat water as a controllable operating-expense category, not a fixed utility line.
14.7%
San Diego
Water increase
18%
Columbus
Water increase
$2.20/kGal
Denver
Tier 3 drought charge
National
Pattern
Infrastructure plus scarcity
What changed
The 2026 market scan shows a broad utility-cost pattern, not a cluster of isolated local events. Large metros, small cities, California Proposition 218 agencies, drought-exposed Western utilities, and growth markets are all adjusting water, sewer, stormwater, drought, or meter-based costs.
The drivers vary by market: imported water in San Diego, capacity growth in Columbus, drought pricing in Denver and Aspen, multi-year infrastructure schedules in California, meter-size charges in Tacoma, sewer formulas in Goodyear and Toledo, commercial water tiers in Cincinnati, and revenue stability in New York City.
Commercial impact model
For a property paying $10,000/month in combined water and sewer, each 5% blended increase adds $6,000/year. Each 10% blended increase adds $12,000/year. For high-use properties at $25,000/month, those same rate moves become $15,000 to $30,000/year.
The biggest mistake is using residential examples to budget commercial exposure. A city may quote a $10/month average household increase while a hotel, hospital, laundry, car wash, or multifamily building sees five-figure annual movement.
What operators should do
Build a water-rate risk register. Track effective date, rate type, affected line item, current kGal, meter size, sewer linkage, stormwater charges, irrigation class, and whether the change is a one-year adjustment or a multi-year schedule.
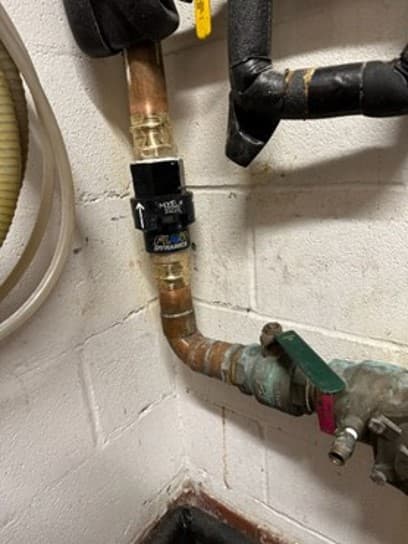
Then rank meters by exposure. A meter with high usage in a city with rising volumetric rates is a priority candidate for water efficiency, leak review, meter accuracy testing, irrigation controls, and Smart Valve evaluation.
Commercial Water Cost Alert
Model Your Facility's Exposure
Use your current monthly bill or kGal usage to estimate how much metered-volume reduction could offset this local rate pressure.
FAQ
Are water rates rising nationally in 2026?
Yes. The 2026 market scan shows water, sewer, drought, stormwater, and meter-size cost pressure across multiple U.S. markets, including San Diego, Columbus, Denver, Aspen, Tacoma, Goodyear, Toledo, Cincinnati, West Sacramento, Cerritos, Pasco, Salt Lake City, San Francisco, Elkins, and New York City.
What commercial properties are most exposed to water rate increases?
Hotels, multifamily properties, restaurants, car washes, laundries, hospitals, food processors, campuses, and large irrigated properties are most exposed because their water and sewer bills scale heavily with metered volume.
Sources
Turn Rate Pressure Into a Water Savings Plan
Smart Valve helps commercial properties reduce metered volume before higher rates and surcharges multiply the cost of every gallon.
Calculate Your Savings